what is Linearisation, and why do you need it? We take a look into the world of Linearisation and why you need it for your flow measurement solutions.
Linearisation is a process that enhances the accuracy of any repeatable flow meter. A standard calibration of our VFF flow meter will involve 10 calibration points. These are always spread out along our customer’s operating flow range. Distributed in favour of lower flow rates, where changes in raw meter accuracy are higher.
Below is an example of a flow meter calibration curve. The results of a calibration are a table of flow rates and the corresponding pulses per litre. In an ideal world, there would be a hundred or a thousand such points so that they complete curve could be plotted and for any flow rate, the pulses per litre would be known. However in reality there are normally between 10 and 20.
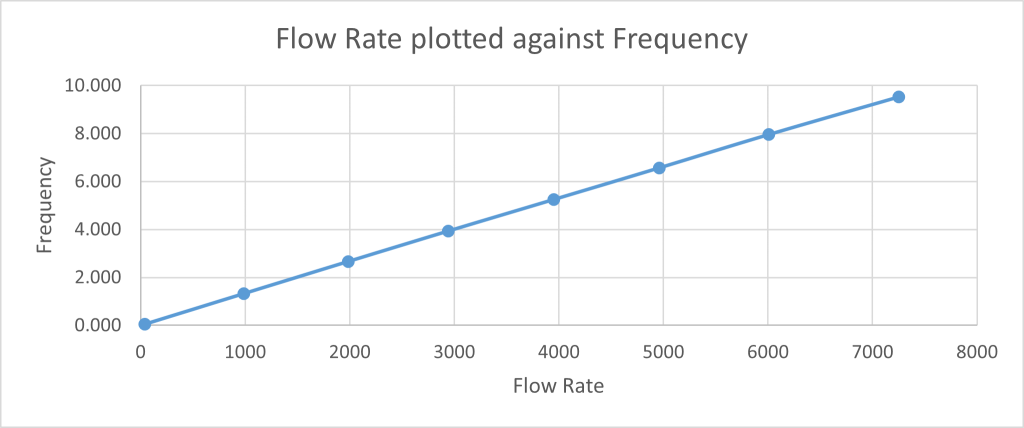
A plot of flow rate against frequency would be an apparent straight line relationship. The angle of the straight line would be the ‘meter factor’ or the average number of pulses per litre.
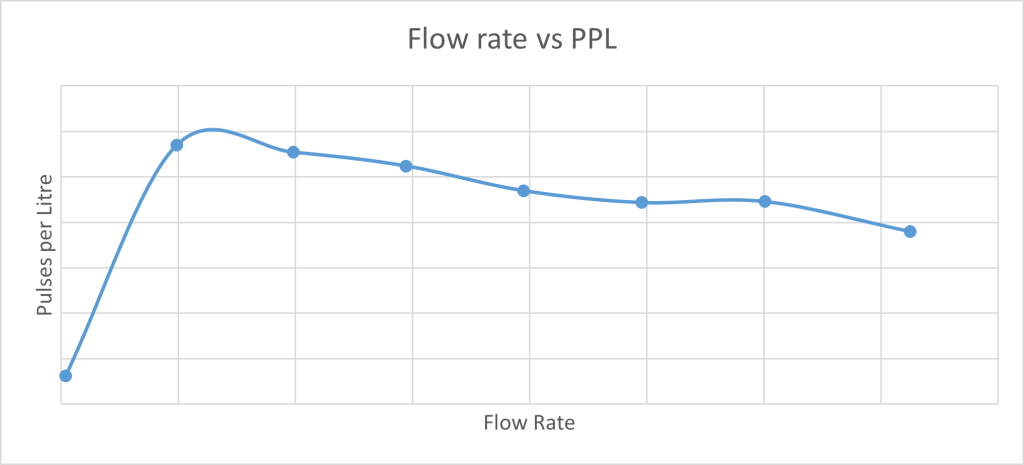
To make this more visual, it’s common to plot the flow rate against the ‘pulses per litre’. This emphasizes the changes as the flow rate increases.
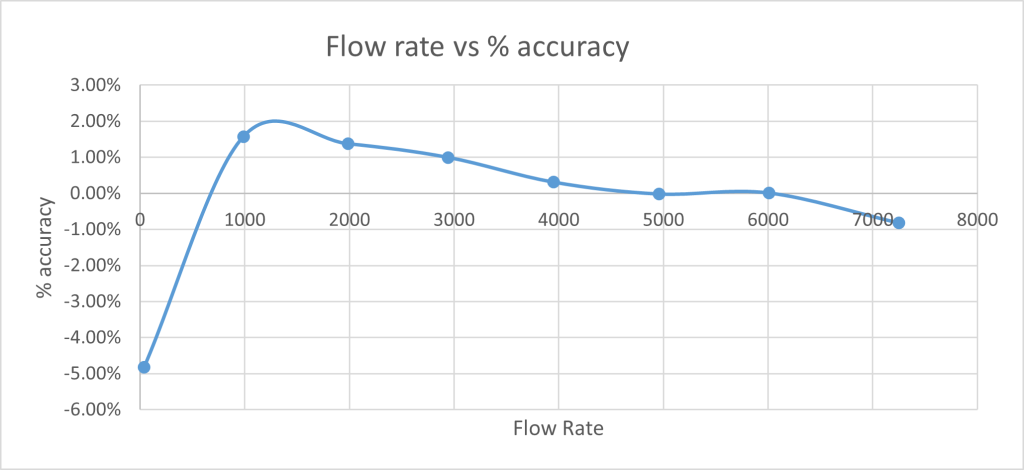
Better still is a plot of flow rate against accuracy using the ‘meter factor’ as a zero. The biggest positive excursion defines the positive error and the biggest negative excursion is the negative error.
Repeatable flow meters
If the flow meter is repeatable then we can use the Linearisation technique. In other words, if the curve (the relationship between flow rate and pulses per litre) is the same the next time around, then the flow rate can be calculated from the frequency output using the specific pulses per litre value rather than the average pulses per litre value. If the flow rate is identical to one of the original calibration points, there is no adjustment. At other flow rates a calculation is required. In between the points, most Linearisation systems use simple linear interpolation. For example, if the flow rate is halfway between two original calibration points, then an average of the pulses per litre for those two points is used.
If enough calibration time is available and the repeatability of the system is considerable then more points can be selected for the Linearisation table.
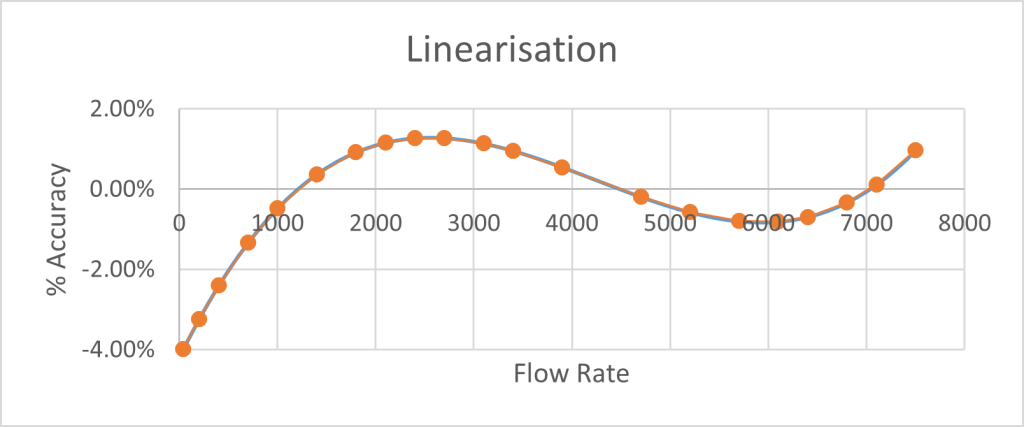
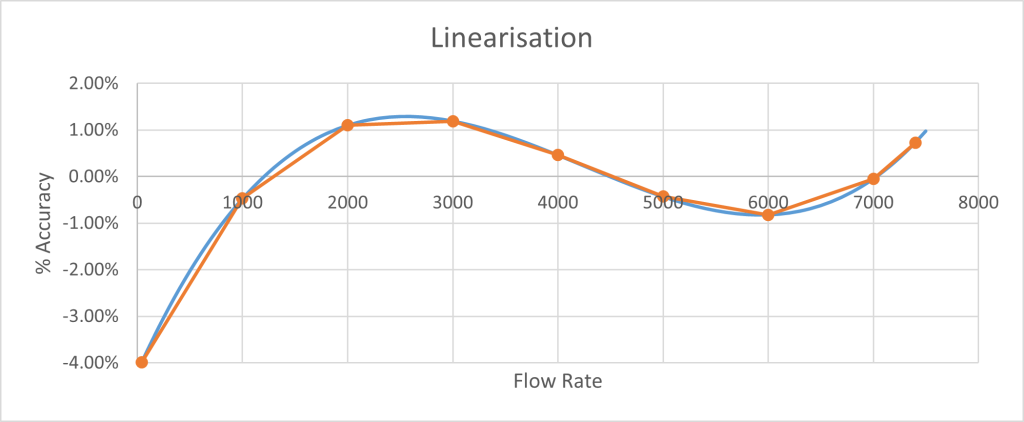
Now the measurement error is no longer compared to a single meter factor from min to max but a linearity curve built into the flow meter. By carefully selecting the calibration flow rates along the range, the remaining error ca be minimised. In the example below, the actual curve (in blue) is shown plus the linear approximation (in brown).
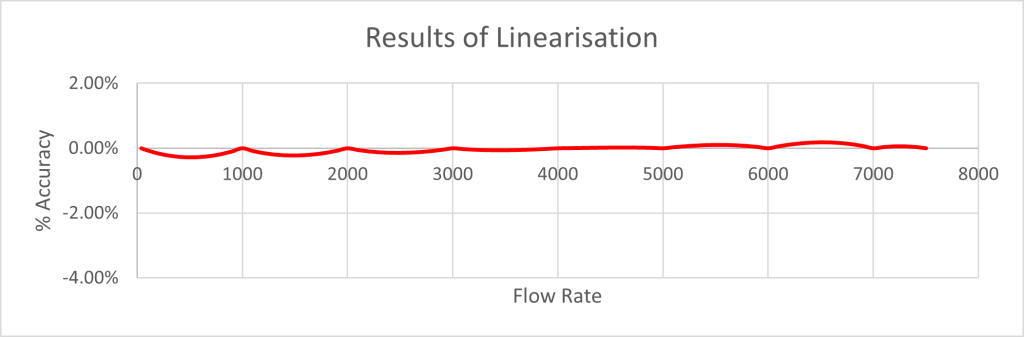
Magnified in scale; here is how this linearisation improves the accuracy, on the same scale:
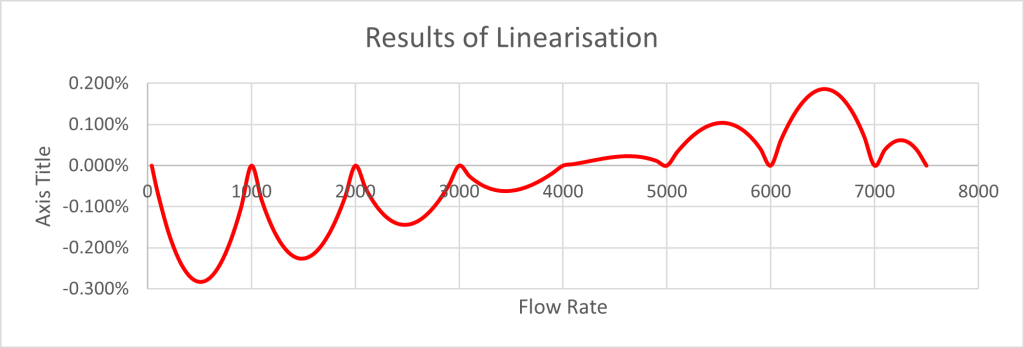
Magnified further in scale:
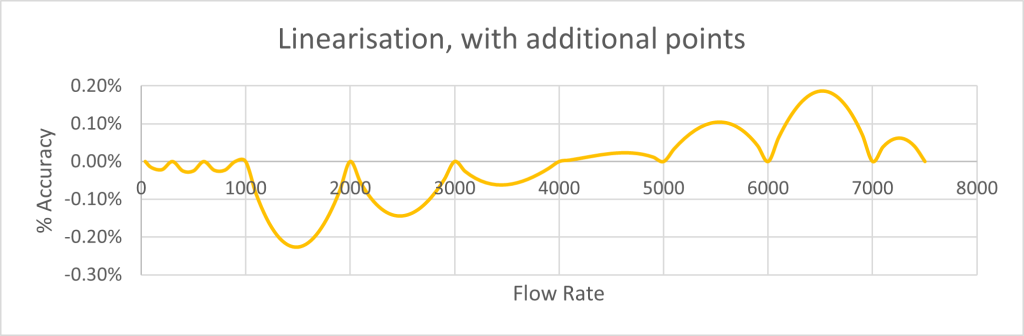
And here is the results, if there are four calibration points at the lowest flow rates rather than two.
As a result of linearisation, the overall error has been reduced from the max error: 1.19%, min error: -3.98% to max error: +0.19%, min error: -0.28% representing an 11x improvement. Selecting the calibration points carefully improves this further. Every calibration point has a cost so there are diminishing returns. If the repeatability is +/- 0.25% then 10 points overall are normally enough.
If enough calibration time is available and the repeatability of the system is considerable then more points can be selected for the linearisation table. In this extension of the example above 21 points are used rather than just 10. Arranged carefully throughout the flow range, the net effect is to reduce the max/min to 0.08%, a 64x improvement over the non-linearised version. If the repeatability of the system was ±0.1% then no more points are required. The flow meter response (blue) is almost perfectly matched by 21 carefully selected calibration points (brown).